
Measuring Digital Marketing Effectiveness


Measuring digital marketing effectiveness is all about figuring out if your campaigns are actually hitting their mark. It means tracking the right numbers to see how your efforts translate into revenue, what’s working, and where you can make smarter decisions.
Without solid measurement, you're essentially just throwing money at the wall and hoping something sticks.
Why Effective Marketing Measurement Matters
Let's get past the obvious—every marketer knows measurement is important. The real reason it matters is because you have limited resources. Your time, your budget, your team's talent... it's all finite. The goal is to pour those resources where they'll make the biggest splash.
Without a clear way to measure what you're doing, you're operating in the dark. This isn't just inefficient; it creates real risks that can stall your growth. You could be dumping cash into a social channel that racks up likes but brings in zero leads, all while cutting the budget for an SEO campaign that's quietly building a pipeline of high-value customers. You’re completely blind to these crucial dynamics if you aren't tracking the right things.
The Dangers of Flying Blind
Ignoring proper measurement is a massive strategic liability. You might be dealing with these common problems right now without even realizing it:
- Wasted Budget: Spending on channels and campaigns that don’t deliver a positive return.
- Missed Opportunities: Failing to spot your most profitable activities and double down on them.
- No Strategic Direction: Making big decisions based on gut feelings instead of hard evidence.
- Inability to Prove Value: Struggling to show the leadership team how marketing actually impacts the bottom line.
At its core, measurement is about connecting your marketing actions to real business outcomes. It’s about proving that the dollars you spend are bringing more dollars back in.
A Powerful Approach to Get Started
The good news? You don't need a massive, enterprise-level analytics team to get this right. Starting with a simple but powerful approach is all it takes to build a solid foundation.
It all begins with defining what "success" actually looks like for your business. From there, you can pick the right metrics to track your progress, which is the first step in truly understanding your performance. This foundational knowledge is crucial for accurately measuring your return on marketing investment and justifying your budget.
This guide will walk you through each step, making sure every marketing move you make is both intentional and measurable.
Aligning Marketing Goals with Business Objectives
The most precise measurement in the world is useless if you're tracking the wrong thing. I've seen countless marketing teams chase metrics that look great on paper but do absolutely nothing for the business. This is why effective measurement starts by asking a simple, yet critical question: "What does the business actually care about?"
Answering this question is the vital first step. It bridges the gap between your day-to-day marketing activities and the company's bottom-line results, whether that's revenue growth, breaking into a new market, or improving customer retention.
Without this alignment, you risk celebrating wins that don't matter. A viral social media post is great, but if it doesn't lead to a single new customer, did it really move the needle for the business? Connecting marketing goals directly to business objectives ensures that every metric you track is a clear signal of meaningful progress.
This is where the SMART goal framework comes in handy. It forces you to move beyond vague aspirations like "increase brand awareness" and create tangible targets you can actually hit.
From Vague Ideas to SMART Goals
A SMART goal is Specific, Measurable, Achievable, Relevant, and Time-bound. It’s the difference between saying "we want more traffic" and declaring "we will increase organic search traffic from non-branded keywords by 20% in the next quarter." The second goal gives you a clear finish line and a way to measure your progress.
Let's walk through a real-world scenario. An e-commerce business has a broad objective to grow its market share. A vague marketing goal would be something like "improve our SEO."
Here’s how we transform that into a SMART goal:
- Specific: Increase organic search rankings for our top 10 "high-intent" product category keywords.
- Measurable: Achieve top 3 rankings for at least five of these keywords.
- Achievable: Based on current performance and competitor analysis, this is a challenging but realistic target.
- Relevant: Higher rankings for these terms directly lead to more qualified traffic and sales, supporting the market share objective.
- Time-bound: Accomplish this within the next six months (by the end of Q4).
This level of clarity provides your team with a precise target to aim for, making it far easier to measure effectiveness along the way. If you want to dive deeper into crafting objectives that work, exploring different frameworks can be a game-changer. You can learn more by checking out our guide on powerful ABCD objective examples.
The infographic below gives you a good sense of how key metrics often appear on a typical performance dashboard, visualizing what you should be tracking.
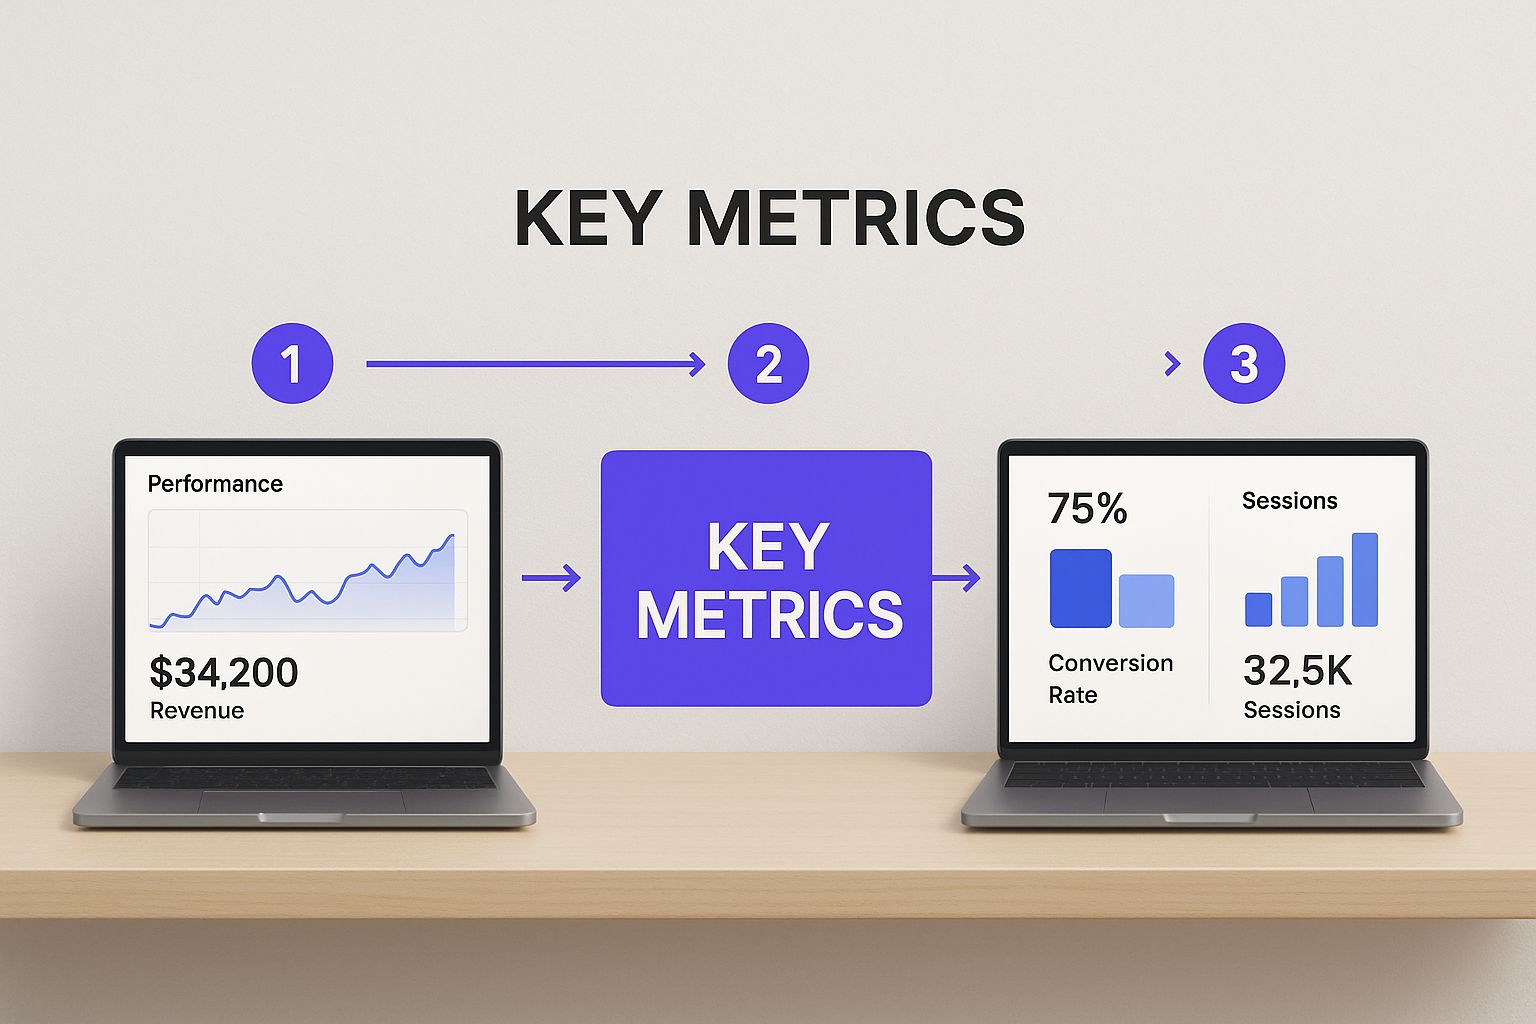
This kind of dashboard illustrates how metrics like conversion rates and user engagement are displayed, providing a quick, at-a-glance snapshot of campaign health.
Selecting KPIs That Truly Matter
Once your goals are set, the next step is choosing the Key Performance Indicators (KPIs) that will tell you if you're on track. A KPI is simply a quantifiable measure used to evaluate how you're performing against your objectives.
It's absolutely crucial to distinguish between actionable metrics and vanity metrics. I can't stress this enough.
- Vanity Metrics: These look impressive on the surface but don't actually correlate with business success. Think page views, social media likes, or total followers. They feel good but offer very little strategic value.
- Actionable Metrics: These provide clear insights that help you make better decisions. Examples include Conversion Rate by Traffic Source, Customer Acquisition Cost (CAC), and Customer Lifetime Value (CLV).
The core purpose of a KPI is to provide a clear, unambiguous signal of performance. If a metric doesn't help you make a decision, it's not a true KPI for your business.
Modern digital marketing is incredibly data-driven, with indicators like return on investment (ROI) and conversion rates playing central roles. Research consistently highlights that organic channels are powerhouses for ROI. In fact, SEO, websites, and blogs collectively account for 16% of channels delivering the highest ROI globally. This is backed up by the fact that 91% of marketers report SEO improved their website's performance and helped them reach their goals.
Matching Marketing Goals to Actionable KPIs
To make this practical, let's tie specific business objectives to marketing goals and their corresponding KPIs. This ensures every number you track has a purpose and a direct link back to what the company is trying to achieve.
The table below breaks down how to connect high-level business goals with the specific marketing KPIs you should be measuring. Think of it as a cheat sheet for ensuring your efforts are always aligned with what matters most.
Matching Marketing Goals to Actionable KPIs
| Business Goal | Corresponding Marketing Goal | Primary KPIs | Secondary KPIs |
|---|---|---|---|
| Increase Revenue by 15% in Q3 | Generate 500 Marketing Qualified Leads (MQLs) | Conversion Rate, Cost per Lead (CPL), MQL-to-SQL Rate | Landing Page Views, Form Submission Rate, Lead Source Breakdown |
| Grow Market Share by 5% | Increase Brand Awareness and Organic Visibility | Organic Traffic, Branded Search Volume, Share of Voice (SOV) | Keyword Rankings, Social Media Mentions, Website Impressions |
| Improve Customer Retention | Enhance Customer Engagement and Loyalty | Customer Lifetime Value (CLV), Churn Rate, Repeat Purchase Rate | Email Open/Click Rate, Net Promoter Score (NPS), Average Session Duration |
| Reduce Customer Acquisition Cost | Optimize Paid Advertising Spend and Efficiency | Customer Acquisition Cost (CAC), Return on Ad Spend (ROAS) | Cost per Click (CPC), Click-Through Rate (CTR), Conversion Rate by Channel |
The right set of KPIs will act as your compass. They not only show you where you've been but also guide your strategy and resource allocation moving forward, ensuring every marketing dollar is spent as effectively as possible.
Building Your Marketing Measurement Toolkit
Once you’ve locked in your goals and picked your KPIs, it’s time to assemble the tech that will pull in all that critical data. Measuring your marketing effectiveness really comes down to having a solid tech stack, but don't worry—you don’t need some overly complex or expensive setup to get going.
It’s all about choosing the right tools for your specific measurement needs. Think of this toolkit as your command center. It’s where raw clicks, views, and interactions get collected and organized, ready for you to turn them into insights. Without these tools, even the best measurement plan is just wishful thinking.
The Foundational Non-Negotiables
Every single marketer today needs a few core platforms to get a basic read on performance. These are the absolute minimum for understanding your website traffic and how you show up in search. Don't skip these.
- Google Analytics 4 (GA4): This is the central nervous system for your website data. GA4 is essential for answering questions like, "Where are my visitors actually coming from?" and "Which pages are convincing them to convert?" It tracks user behavior, traffic sources, conversions, and so much more.
- Google Search Console (GSC): While GA4 tells you what happens on your site, GSC tells you how people find you in Google's search results in the first place. It’s packed with crucial data on your keyword rankings, click-through rates from search, and any technical SEO hiccups holding you back.
This screenshot from a Google Analytics dashboard gives you a great visual on user acquisition data over a specific timeframe.

You can see the different channels driving traffic at a glance, allowing you to quickly spot which sources are your top performers.
Expanding Your Toolkit for Deeper Insights
Beyond the basics, your toolkit will grow based on the channels you’re active on and the level of detail you need. To get the most out of these tools, it helps to have a firm grasp of the key digital marketing performance metrics that will give you the most valuable insights.
This is where you start adding specialized platforms for a more granular view of what’s happening.
Channel-Specific Analytics
Every platform you market on has its own analytics suite. Tapping into these is vital for understanding your performance within that specific ecosystem.
- Meta Business Suite: If you’re on Facebook and Instagram, this is your go-to for deep insights on post engagement, audience demographics, and ad performance.
- LinkedIn Analytics: Absolutely crucial for B2B marketers. It helps you track follower growth, post engagement, and visitor demographics for your company page.
- TikTok Ads Manager: This gives you all the detailed metrics on video views, completion rates, and conversion tracking for your TikTok campaigns.
To bring everything together, it’s worth exploring some powerful social media reporting tools that can pull all this data into one place and save you a ton of time.
Customer Relationship Management (CRM) Systems
A CRM is where you finally connect your marketing efforts to actual sales. It lets you track the entire customer journey, from that very first touchpoint to the final sale and any repeat business.
- HubSpot: A fantastic all-in-one platform that combines marketing, sales, and service tools. It makes it easy to see which campaigns are generating leads that actually turn into paying customers.
- Salesforce: A powerhouse CRM known for its robust reporting features, allowing you to tie marketing activities directly to revenue.
A CRM transforms your measurement from tracking anonymous clicks to understanding the real behavior of leads and customers. It’s the final piece of the puzzle for calculating true marketing ROI.
Ensuring Data Accuracy From Day One
Your tools are only as good as the data they collect. Messy, inaccurate data leads to bad insights and, ultimately, poor decisions. To prevent this, there are two critical setup tasks you need to nail from the very beginning: conversion tracking and UTM parameters.
Set Up Meticulous Conversion Tracking
A conversion is any valuable action a user takes, like filling out a form, making a purchase, or signing up for your newsletter. You have to explicitly tell your analytics tools what these actions are.
For example, in GA4, you can set up events and then mark the most important ones as conversions. This is completely non-negotiable if you want to measure what truly matters to your business.
Implement a Consistent UTM Strategy
UTM parameters are simple tags you add to the end of your URLs to track the source, medium, and campaign associated with each click. They tell Google Analytics exactly where your traffic came from with incredible precision.
Without UTMs, a huge chunk of your traffic will get lumped into "Direct" or "(not set)," leaving you blind to what’s actually working. A consistent UTM strategy is the bedrock of clean, reliable marketing data.
A standard UTM structure might look something like this:
| Parameter | Example Value | Purpose |
|---|---|---|
utm_source |
facebook |
Identifies the traffic source |
utm_medium |
social_cpc |
Specifies the marketing medium |
utm_campaign |
summer_sale_2025 |
Names the specific campaign |
Turning Raw Data into Actionable Insights
Collecting data is the easy part. The real work begins when you need to turn that mountain of raw numbers into a clear story that actually helps you make better decisions. Your analytics platforms are overflowing with metrics, but without smart analysis, they're just noise. The goal is to get past simply reporting what happened and start digging into why it happened—and what you should do next.
This is where true analysis comes in. It’s about looking at the numbers, asking tough questions, and connecting the dots to guide your strategy. To really get this right, you need to embrace data-driven marketing, which is all about using customer information to make smarter, more informed choices.
Slice Your Data with Segmentation
One of the most powerful ways to find hidden insights is segmentation. Instead of looking at your website traffic as one giant, faceless blob, segmentation lets you slice it into smaller, more meaningful groups. This is where the magic happens, revealing patterns you’d otherwise miss completely.
Think about it. Your overall conversion rate might be 3%. That number alone doesn't tell you much. But what happens when you start segmenting?
- By Channel: You might find that organic search converts at a healthy 6%, but your paid social ads are lagging at just 1.2%. Right away, you know where your most valuable traffic is coming from.
- By Device: Maybe you discover that desktop users convert at 5%, while mobile users are only converting at 0.8%. That’s a massive red flag screaming that your mobile experience is broken and needs immediate attention.
- By Demographic: You could learn that users aged 25-34 are your most profitable segment, giving you a crystal-clear signal on who to target in your next campaign.
Segmentation turns vague data points into specific, actionable areas for improvement, pinpointing your strengths and weaknesses with incredible precision.
Pinpoint Leaks with Funnel Analysis
Every customer takes a series of steps before they convert—that's your marketing funnel. A funnel analysis is a visual map of this journey, showing you exactly where potential customers are dropping off. It’s one of the most direct ways to measure marketing effectiveness because it shines a spotlight on friction points.
Let's look at an e-commerce checkout process:
- 1,000 users add a product to their cart.
- 600 users proceed to the shipping information page.
- 300 users get to the payment page.
- Only 150 users actually complete the purchase.
In this scenario, you’re losing a staggering 50% of your users between the shipping and payment steps. That’s not a generic problem; it’s a specific leak you can investigate. Are your shipping costs a surprise? Is the payment form clunky and confusing? Funnel analysis tells you exactly where to start digging.
Understand the Customer Journey with Attribution Models
Attribution is all about giving credit where credit is due. In today’s world, a customer might see your Facebook ad, click a link in an email a week later, and finally buy something after a Google search. So, which channel gets the credit? The attribution model you choose is what answers that question, and it can completely change how you see your marketing performance.
Choosing an attribution model isn't just a technical setting in your analytics; it's a strategic decision that dictates how you value each marketing touchpoint and, ultimately, where you invest your budget.
There are a few common models you'll run into:
- First-Touch Attribution: This model gives 100% of the credit to the very first channel a customer interacted with. It’s great for understanding which channels are best at generating initial awareness.
- Last-Touch Attribution: This gives 100% of the credit to the final touchpoint before a conversion. It’s the simplest model, but it often overvalues bottom-of-funnel channels like branded search.
- Linear Attribution: This model spreads credit equally across every single touchpoint in the customer's journey, acknowledging that multiple interactions played a role.
The model you pick should line up with your business goals. If you're focused on top-of-funnel growth and bringing in new people, first-touch might give you the best insights. But if you have a long sales cycle, a linear model will provide a more balanced view of what’s really working.
Connecting all these data points is what separates good marketers from great ones. For instance, 76% of users report that social media content influenced their purchase decisions, a figure that jumps to 90% for Gen Z. This shows just how critical it is to have precise tracking in place. Aggregating this data is key, and you can learn how to build a comprehensive view in our guide to creating a powerful social media reporting dashboard.
Optimizing Campaigns with Data-Driven Decisions
So, your data has told a story. Now it’s time to write the next chapter.
This is the point where measuring your marketing effectiveness stops being a passive reporting task and becomes a powerful engine for growth. The insights you’ve gathered are the fuel for making smarter, faster decisions that actually move the needle. It's all about closing the loop—taking what you’ve learned and using it to actively improve every single part of your campaigns.
This whole process is really a continuous cycle of optimization. You don't just analyze the data, file a report, and call it a day. Instead, you use those findings to form a new hypothesis, test it, measure what happens, and do it all over again. This iterative approach is what separates the high-performing marketing teams from everyone else.

From Insight to Hypothesis
Every great optimization starts with a solid hypothesis—an educated guess rooted in your data. This isn't just a random shot in the dark; it’s a specific, testable statement that connects an observation you made to a result you expect.
A good hypothesis follows a simple framework: "Based on [this data observation], we believe that making [this change] will result in [this specific outcome]."
Let’s say your funnel analysis uncovers a massive drop-off on your main landing page. That's your observation. Your hypothesis could look something like this: *"Our funnel analysis showed a 70% exit rate on the landing page, so we predict that changing the generic 'Submit' button to a more benefit-driven CTA like 'Get Your Free Quote' will increase form submissions by 15%."*
That statement is powerful. It's specific, it's measurable, and it’s directly tied to a business goal (getting more leads).
Practical Testing for Real Results
With a hypothesis ready to go, you need a reliable way to test it. A/B testing, or split testing, is the gold standard here. You simply create two versions of a single element—like a headline, an image, or a call-to-action button—and show each version to a different segment of your audience to see which one performs better.
Here are a few common elements that are perfect for A/B testing:
- Email Subject Lines: Test a straightforward subject line against one that creates a sense of urgency or curiosity.
- Landing Page Headlines: Pit a headline focused on features against one that highlights benefits.
- Ad Creative: Run two different images or videos for the same ad to see which one grabs more attention and drives a higher click-through rate.
The golden rule is to only test one variable at a time. If you change the headline, the image, and the CTA all at once, you’ll have no idea which change was actually responsible for the results.
Reallocating Your Budget with Confidence
One of the most powerful outcomes of measuring effectively is the ability to shift your budget to the channels that deliver the best return. Your data should make it crystal clear which platforms are driving valuable conversions and which are just eating up your cash.
Imagine your data shows that for every $1 you spend on Google Ads, you get $5 back in revenue (that's a 5x ROAS). But for every $1 spent on a certain social media platform, you're only getting $0.50 back. The decision becomes pretty obvious.
Data-driven budget allocation isn't about cutting costs; it's about reallocating resources from low-ROI activities to high-ROI activities, maximizing the impact of every dollar you spend.
This might mean pausing that underperforming social campaign and reinvesting that money into your top-performing Google Ads campaigns. A great way to keep on top of this is by using a specialized tool to understand your returns. If you're focused on social media, you can learn more by exploring our detailed guide and social media ROI calculator.
Adjusting Content Based on Engagement
Your audience is constantly telling you what they want through their behavior. Are they spending more time on your long-form blog posts or your short, snappy video tutorials? Are they engaging more with case studies or with industry trend reports?
Use metrics like Average Time on Page, Scroll Depth, and Social Shares to guide your content strategy. If you notice your articles about a particular topic consistently get high engagement and lead to newsletter sign-ups, that's a clear signal to create more content on that subject.
This feedback loop ensures you’re not just creating content you think your audience wants, but content they've already proven they value.
Got Questions About Marketing Measurement?
Even with the best framework in place, you're bound to run into some practical questions once you start measuring your digital marketing. It happens to everyone. Let's walk through a few of the most common hurdles I see marketers face so you can keep your team focused on what actually moves the needle.
One of the first things people ask is how often they should be glued to their dashboards. There's no single right answer—it really depends on the metric's purpose and how fast your campaigns are moving. You need to find a rhythm that lets you make smart moves without overreacting to the normal, everyday noise in the data.
How Often Should I Review My Marketing Metrics?
Finding a consistent reporting cadence is everything. Different numbers need different levels of attention to tell you anything useful.
- Daily or Weekly Checks: If you're running active paid ad campaigns, you need to be watching metrics like Click-Through Rate (CTR) and Cost Per Conversion like a hawk. This lets you make quick, tactical tweaks to ad creative, targeting, or bids before you blow through your budget.
- Weekly or Bi-Weekly Reviews: Broader metrics like overall website traffic, channel performance, and engagement rates are usually best reviewed weekly. This helps you spot trends as they emerge or catch a sudden drop that might point to a broken link or a technical glitch.
- Monthly or Quarterly Analysis: Save the big-picture metrics like Return on Investment (ROI) and Customer Acquisition Cost (CAC) for monthly or quarterly analysis. These numbers give you a strategic view of how your marketing is actually impacting the bottom line.
The goal is to create a schedule that helps you act on data with purpose. Constantly refreshing your metrics dashboard can lead to knee-jerk decisions based on tiny data blips instead of real trends.
What Is the Biggest Mistake People Make?
Easy. The most common trap I see is getting obsessed with vanity metrics instead of actionable ones. Vanity metrics are the numbers that look impressive in a report but have zero connection to your actual business goals—think social media likes or total impressions. They feel good, but they don't help you make strategic decisions.
Actionable metrics, on the other hand, give you clear insights you can actually use. We're talking about things like Conversion Rate by Traffic Source or Cost Per Lead (CPL). To steer clear of this mistake, always ask yourself one simple question: "Does this number help me make a smarter decision?" If the answer is no, it's probably just noise.
How Can I Measure Content Marketing Effectiveness?
Measuring content is a bit trickier because a single blog post can do a lot of different jobs across the marketing funnel. You have to look at the whole journey.
For top-of-funnel awareness, you'll want to track things like organic traffic, new users, and keyword rankings. To measure mid-funnel engagement, look at metrics like time on page, newsletter sign-ups, and gated content downloads.
Finally, for bottom-funnel conversions, you need to use attribution tracking in your analytics and CRM. This is how you connect specific articles or guides to qualified leads and, ultimately, sales. The dream is to be able to draw a straight line from a piece of content all the way to revenue.
Ready to stop guessing and start growing? At MakerBox, we provide AI-driven tools to transform your entire professional online presence, ensuring your content and profiles attract maximum engagement. Elevate your personal brand and see real results at https://www.makerbox.io.