How to Measure Social Media Success the Right Way


Measuring social media success isn't about guesswork. It's about connecting your efforts to real business goals, tracking the right numbers with the right tools, and tweaking your strategy based on what the data tells you. It's time to move past the simple vanity metrics like follower counts and focus on what actually grows your business—things like leads, sales, and genuine customer loyalty. This is how you turn social media from a content machine into a predictable source of business value.
Moving Beyond Likes to Meaningful Metrics

Let's be honest, watching your follower count climb and likes roll in feels great. It’s a quick shot of validation, a sign that people are seeing your content. But when it's time to justify your budget or prove your impact on the bottom line, those numbers often fall flat. We call these vanity metrics—they look good on the surface but don't tell the full story.
The real challenge, and where the true value lies, is figuring out how to measure social media in a way that connects directly to business outcomes. It’s the only way to transform your social media efforts from an expense into a measurable investment.
Shifting Your Measurement Mindset
The first step is a mental one. Stop asking, "How many likes did this post get?" and start asking, "What business goal did this post support?" This simple change in perspective reframes your entire approach. Instead of chasing fleeting engagement, you start building a strategy designed to produce tangible results.
Think of it this way: a viral post that gets millions of views but generates zero leads is ultimately less valuable than a targeted post that reaches just 500 people but brings in ten qualified leads. This is the core principle of effective social media measurement.
The goal isn't just to be popular on social media, but to be profitable. True success is measured by how effectively your social presence supports your business objectives, not just by the numbers on a dashboard.
This shift requires you to look beyond the built-in analytics of each platform. While native tools are great for post-level data, they often don't connect the dots to your website, sales funnel, or CRM. To get a complete picture, you need a framework that ties everything together.
Building a Foundation for Real Measurement
A solid measurement framework starts with clarity. What do you really want to achieve? Are you using social media to build brand awareness, drive traffic to your website, or generate direct sales? Each of these goals requires a different set of metrics.
- For Brand Awareness: You'll focus on metrics like reach, impressions, and share of voice. These show you how many people are seeing your brand and how you stack up against competitors.
- For Audience Engagement: Track comments, shares, and engagement rate. These metrics tell you you’re building a community and that your content is hitting the mark.
- For Conversions: This is where the money is. Monitor click-through rate (CTR), cost per click (CPC), and most importantly, conversion rate. These numbers show how effectively you're turning followers into customers.
This structured approach makes your reporting far more powerful. You’re no longer just presenting a list of numbers; you’re telling a story about how your social media activity is creating real value. For a broader perspective, understanding the principles of measuring advertising effectiveness can provide valuable insights that apply here as well.
Ultimately, a strong measurement plan gives you the data you need to make confident strategic decisions, optimize your content, and prove the undeniable ROI of your social media efforts to any stakeholder.
Choosing KPIs That Align with Your Business Goals
Chasing every social media metric out there is a fast track to getting lost in a sea of data with no real direction. If you want to know if your social media is actually working, you need to pick Key Performance Indicators (KPIs) that connect directly to your bigger business objectives. It's time to ditch the generic dashboards and build one that tells a story of real value.
Instead of a one-size-fits-all list, let's group your KPIs by your core business goals. This simple shift turns measurement from a passive reporting chore into an active, strategic part of your workflow. It helps you answer the only question that matters: "Is what we're doing on social media helping us achieve our goals?"
Match Metrics to Your Mission
The KPIs that an e-commerce brand cares about will look completely different from those of a B2B company focused on thought leadership. Your business model has to be the starting point for your measurement strategy.
For instance, a direct-to-consumer apparel brand will likely obsess over click-through rates (CTR) on product posts and the social media conversion rate from an Instagram Shop campaign. Their success is tied directly to sales.
On the other hand, a B2B software company might be laser-focused on metrics like lead form submissions from LinkedIn ads or the number of downloads for a gated whitepaper they shared on X (formerly Twitter). Their goal isn't immediate online purchases; it's about filling the sales pipeline with qualified leads.
Key Takeaway: Stop borrowing KPIs from other companies. Your dashboard should be a mirror reflecting your unique business goals, whether that's driving sales, generating leads, or boosting brand authority. Every KPI should be a direct line back to your strategy.
This is the foundational step in learning how to measure social media success—tying every single data point back to a specific, desired business outcome.
Core KPI Categories and Examples
To make this easier, we can break down KPIs into four main business objectives. Think about which of these goals is most important for your brand right now and start there.
- Brand Awareness: The main goal here is to expand your reach and get your brand in front of new, relevant audiences.
- Reach: The number of unique people who saw your content.
- Impressions: The total number of times your content was shown.
- Share of Voice (SoV): Your brand's slice of the conversation within your industry compared to competitors.
- Audience Engagement: This is all about building a community and creating a genuine connection with your followers. Authentic interaction is what drives success, not just follower counts. You'll want to track a mix of metrics like post engagement rate, likes, and comments. Shares are especially powerful, as they show user trust and amplify your brand's reach. And don't just look at video views—the video completion rate gives you a much better signal of sustained attention. For a deeper dive, Sprout Social offers great insights on the most important metrics to track.
- Conversion: This category is focused on driving specific, valuable actions from your audience, moving them closer to becoming a customer.
- Click-Through Rate (CTR): The percentage of users who clicked a link in your post.
- Conversion Rate: The percentage of users who completed a desired action (like a purchase or newsletter signup) after clicking.
- Cost Per Conversion: The average amount you spend to get one person to take that desired action.
- Customer Advocacy: This goal is about turning your existing customers into loyal fans who champion your brand for you.
- Customer Testimonials/Reviews: Keeping an eye on positive reviews and user-generated content that features your products.
- Net Promoter Score (NPS): A metric used to gauge customer loyalty by asking how likely they are to recommend your brand.
Here’s a quick-reference table to help you map common business objectives to the right KPIs. This ensures your measurement strategy is tightly aligned with what truly matters to your bottom line.
Matching Social Media KPIs to Business Goals
| Business Goal | Primary KPIs | What It Measures |
|---|---|---|
| Increase Brand Awareness | Reach, Impressions, Share of Voice | How many people are seeing your brand and how you stack up against competitors. |
| Drive Audience Engagement | Engagement Rate, Shares, Comments, Video Completion Rate | How well your content is resonating and building a community. |
| Generate Leads/Sales | Conversion Rate, Click-Through Rate (CTR), Cost Per Conversion | The effectiveness of your social media in driving direct business actions. |
| Build Customer Loyalty | Net Promoter Score (NPS), Customer Testimonials, Repeat Purchases | How happy your current customers are and their willingness to advocate for you. |
Choosing the right KPIs from this framework will give you a much clearer picture of what's working and what isn't, allowing you to make smarter, data-backed decisions.
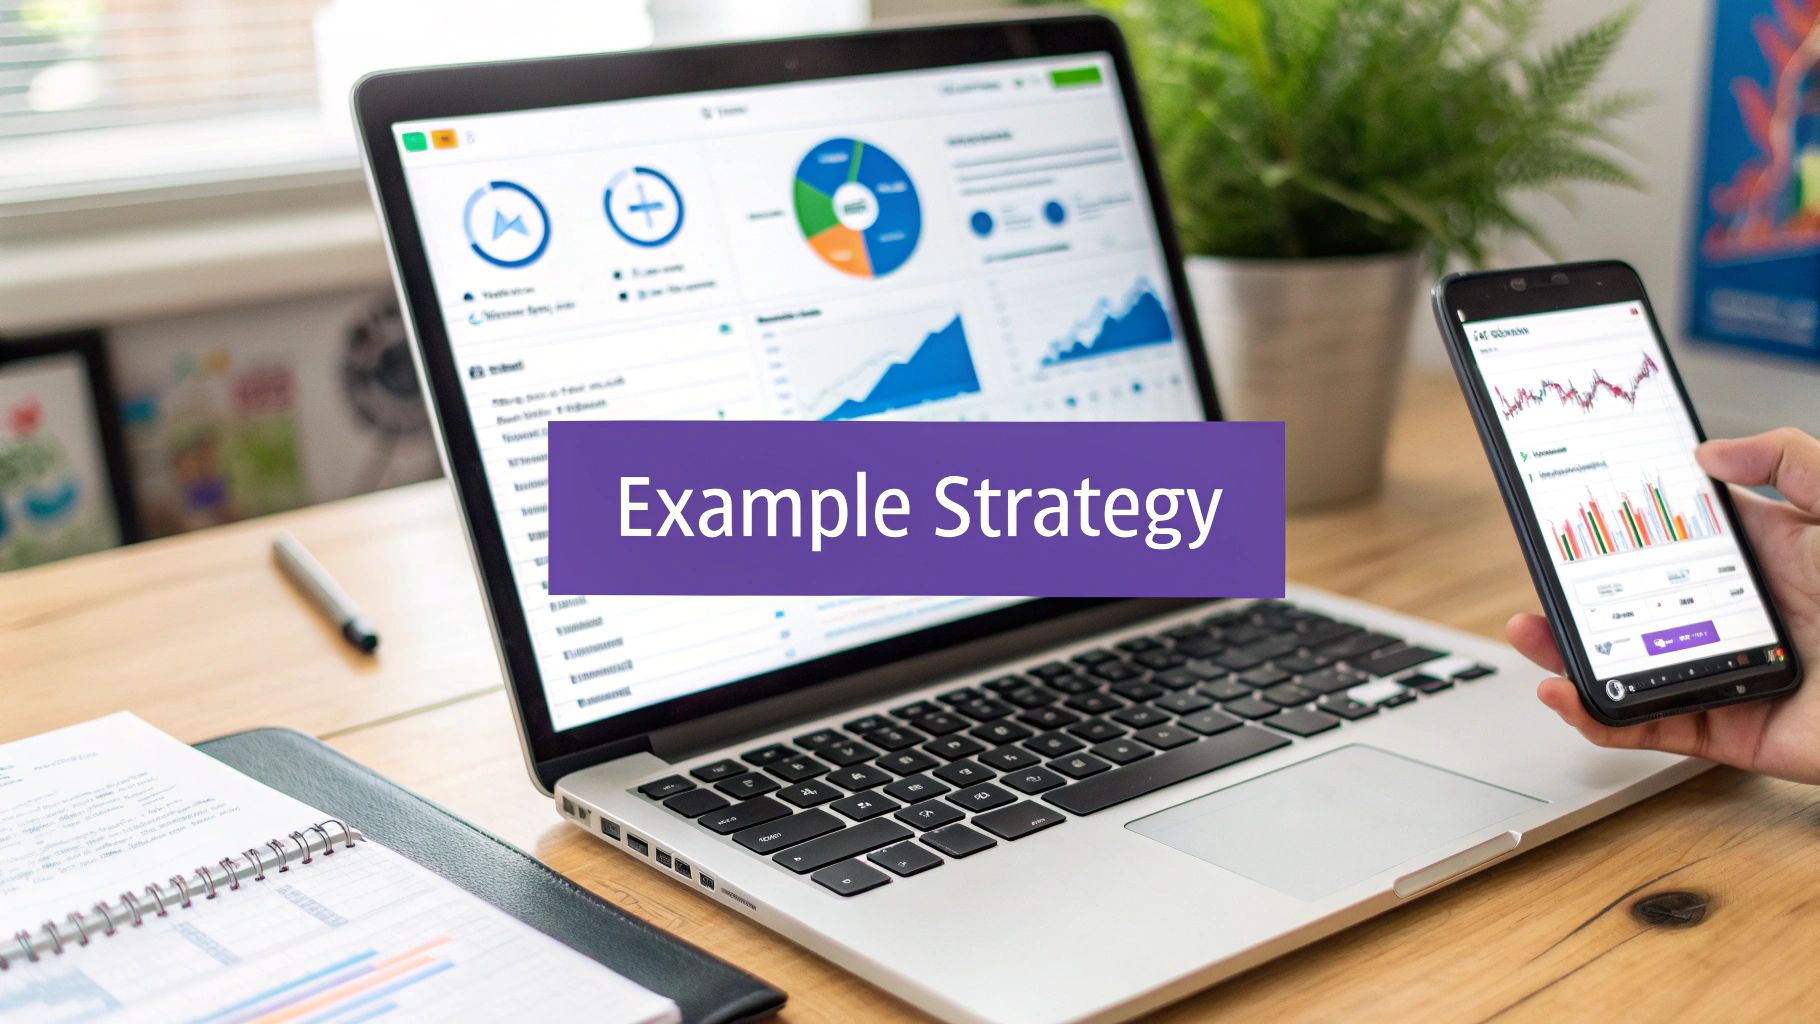
Modern analytics tools make it incredibly convenient to track these vital metrics, often right from your smartphone.
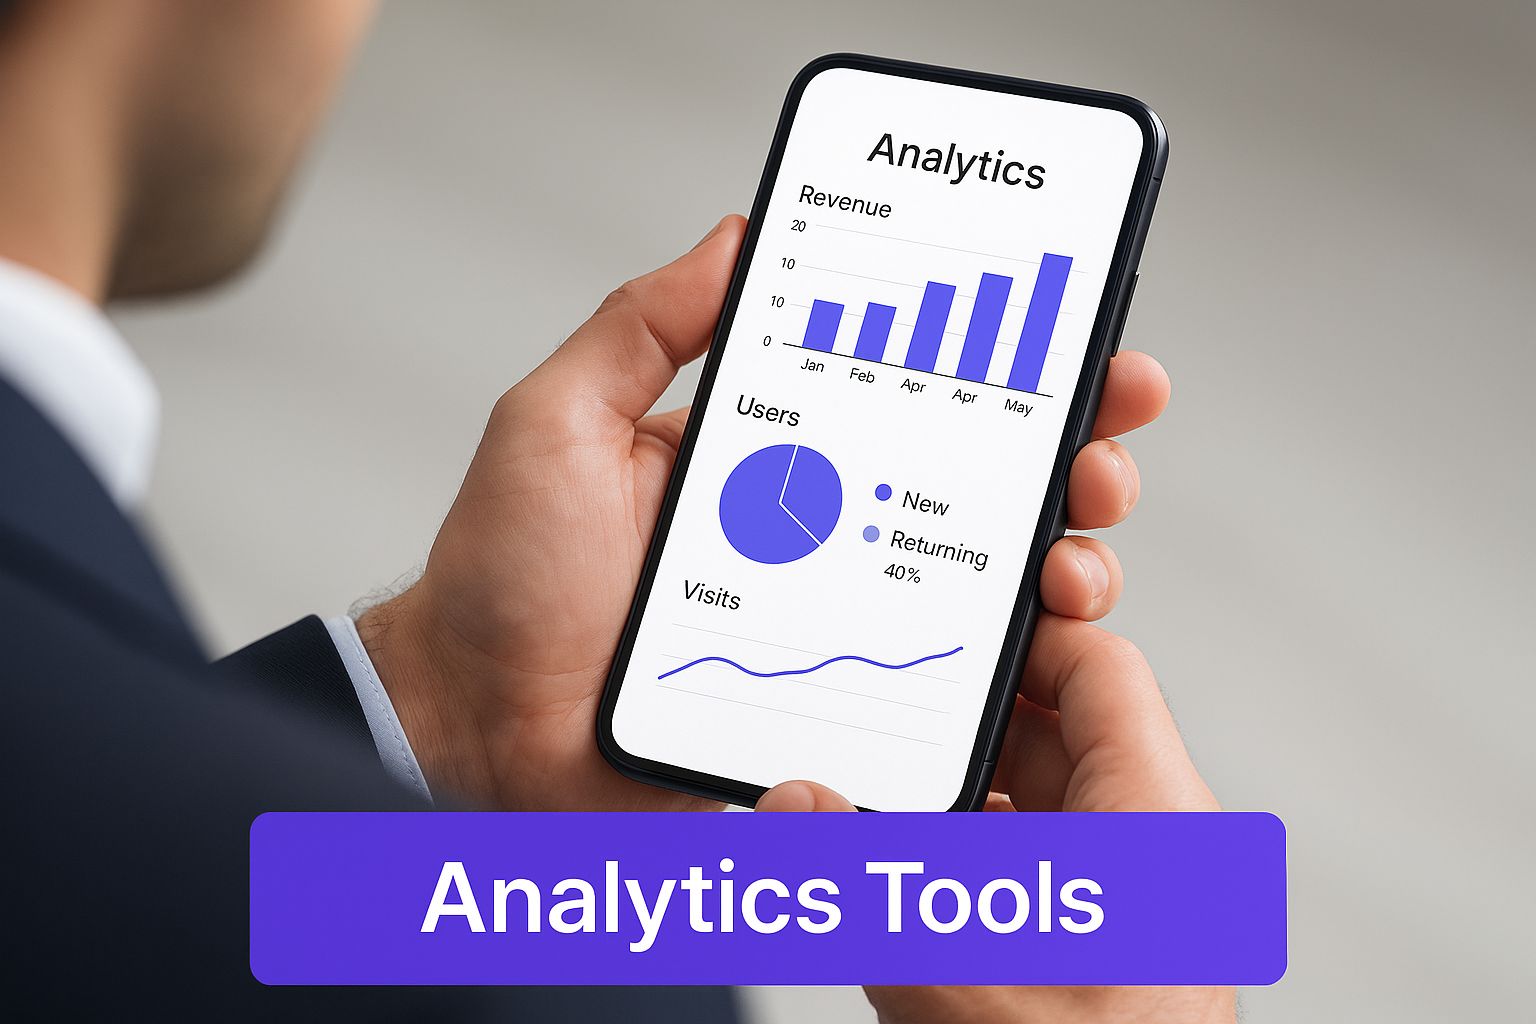
The image above shows just how easy it can be to monitor performance and make data-driven decisions on the go. When you select KPIs that truly matter and track them with the right tools, you create a powerful feedback loop that consistently sharpens your social media strategy.
Finding and Setting Up Your Analytics Tools

Alright, you've got your goals locked in and your KPIs chosen. Now it’s time to pick the right tools to actually track everything. The analytics world can feel like a maze, but you don't need the priciest software to get powerful insights.
The real key is finding something that matches your budget, your technical skills, and the specific KPIs you need to watch. Most people start with the free stuff and slowly level up as their strategy gets more sophisticated. Let's break down the options.
Choosing Your Toolkit: Three Tiers of Analytics
I like to think about social media analytics tools in three distinct tiers. There's no single "best" choice; it's all about what fits your current strategy and where you're headed.
- Native Platform Analytics: This is ground zero. Every major social platform, from Instagram Insights to TikTok Analytics, gives you a free, built-in dashboard. These are fantastic for digging into post-level data like reach, impressions, video views, and basic audience demographics. They give you an immediate pulse on how your content is doing on that specific channel.
- All-in-One Social Media Dashboards: The next step up are tools like Sprout Social, Hootsuite, or Buffer. They pull data from all your social accounts into one place, saving you from endlessly jumping between apps. These are brilliant for creating cross-network reports, scheduling posts, and often come with features for tracking brand mentions. You get a much more complete picture of your overall social presence.
- Advanced Business Intelligence (BI) Tools: This is the top tier, for when you need to connect the dots across the entire business. Think tools like Tableau or pulling your social data into Google Analytics. This is where you can see how social media activity influences things like website traffic and sales. It’s how you truly calculate ROI and understand the impact on the whole customer journey.
A classic mistake I see is people paying for a heavy-duty tool before they’ve even mastered the free ones. Get comfortable with the native analytics first. Once you find yourself spending way too much time pulling individual reports, that's your cue to upgrade to an all-in-one dashboard.
Setting Up for Success: Beyond the Dashboard
Just picking a tool isn't enough. To really measure success—especially when it comes to things like sales or sign-ups—you have to get your tracking set up properly. This is the part many people skip, and it’s where they lose the connection between their social efforts and actual business results.
The first, non-negotiable step is setting up tracking pixels. The Meta Pixel (for Facebook and Instagram) and the TikTok Pixel are tiny bits of code you add to your website. They create a bridge, telling the social platforms when someone who saw your ad or post takes an action on your site, like buying something or filling out a contact form.
Without these pixels, you're basically guessing. You might see a bunch of clicks to your website, but you’ll have no idea which ones actually converted. If you want to measure your social media ROI with any real accuracy, getting these set up is absolutely essential.
Creating Your First Custom Dashboard
Now for the fun part. Once your tools are picked and your tracking is live, it’s time to build a dashboard that gives you answers, not just numbers. Don't settle for the default report. Build a custom view that puts your most important KPIs front and center.
Here’s a simple way to create a basic dashboard focused on awareness and engagement:
- Set Your Timeframe: Start by looking at the last 30 days. This gives you a solid baseline to work from.
- Add Reach and Impressions: Put these right at the top. They give you a quick, high-level look at your overall visibility.
- Track Follower Growth: Add a widget that shows your net follower growth. Is your content bringing new people into your community?
- Spotlight Top-Performing Posts: Dedicate a section to your top three posts by engagement rate. This isn't just about likes; it's about what truly connected with your audience.
- Monitor Clicks: If driving traffic is a goal, make sure you have a widget for total link clicks. This shows you how many people are actually taking that next step.
By focusing your dashboard on these core metrics, you cut through the noise. This simple setup can tell a powerful story about how your social media efforts are building your brand and growing your community.
Alright, let's get down to business. Collecting data is easy—every platform spits out numbers. The real work starts when you have to figure out what those numbers actually mean for your social media strategy. Raw data, like reach and engagement rates, is just noise until you start asking why.
This is the jump from being a data reporter to a data interpreter. You're no longer just listing stats; you're connecting the dots between your content and your audience's reaction. The goal here is to get so comfortable with your analytics that you can make confident, data-backed decisions that genuinely move the needle.
Spotting Trends and Finding the Narrative
Think of your analytics dashboard as a treasure map. A single post’s performance is just one landmark, but a pattern across multiple posts is where you find the X that marks the spot. Your job is to look for these recurring themes.
For instance, maybe you notice your engagement consistently nose-dives on weekends. That’s a trend. The insight comes when you ask why. If your audience is mostly B2B professionals, they're probably just offline. Simple as that. The strategic move? Shift your schedule to focus on weekdays.
Or, let's say you discover your carousel posts consistently get more shares and comments than your single-image posts. That’s not a fluke; it's a direct signal from your audience telling you what they want to see. This insight gives you the green light to create more carousels, knowing they’re a safe bet.
Don’t just report the numbers; interpret them. Ask yourself, "What is this data telling me about my audience's behavior and preferences?" That question is the bridge between data collection and strategic action.
To get these answers, you have to look at your analytics with a critical eye. It's not just about what happened, but digging into why it happened. This curiosity is what separates passive monitoring from active, strategic optimization.
Performing a Simple Monthly Social Audit
To keep this from becoming overwhelming, I recommend a simple monthly social media audit. This isn't some huge, time-sucking report. It's a quick, focused review designed to give you clear, actionable takeaways. At the end of each month, grab your data and ask yourself these three powerful questions:
- What was our biggest win? Find your top-performing post based on engagement rate. Now, dissect it. Was it the topic? The format—maybe a video, carousel, or a surprisingly popular meme? Was it the tone of the caption or the call-to-action? Pinpoint exactly what made it connect.
- What was our biggest flop? Look at your worst-performing piece of content. Be brutally honest about why it tanked. Was the topic a swing and a miss? Was the visual just… boring? Acknowledging what falls flat is just as crucial as celebrating what soars.
- What are the common threads? Lay out your top five and bottom five posts side-by-side. What patterns jump out? Maybe your audience loves seeing behind-the-scenes content but completely ignores your salesy, promotional posts. That's a massive strategic insight right there.
This regular check-in forces you to look past vanity metrics and get to the heart of what’s actually working (or not) in your content strategy.
Contextualizing Your Performance
Finally, it’s critical to remember your performance doesn't happen in a bubble. What's happening in the wider industry can have a huge impact on your numbers. Just look at the year-over-year data—it tells a story of an increasingly crowded and competitive space.
For example, a recent in-depth analysis found that engagement rates have been falling across the board. Facebook engagement dropped by 36%, Instagram by 16%, and X (Twitter) took a 48% hit. Interestingly, that same study revealed that on Instagram, carousels are now outperforming Reels in engagement, which flies in the face of the "video is king" narrative we hear so often. You can read more about these findings in the full social media benchmark report to see how these dynamics play out.
When you combine your own monthly audit with an awareness of these external trends, you get a full 360-degree view. It helps you set realistic goals, make smarter pivots, and turn what was once just a pile of raw data into your most powerful tool for growth.
This is where all your hard work starts to pay off. Measurement is pointless without action, right? The insights you’ve just uncovered are your roadmap to turning a good social media strategy into a great one.
Think of it as a continuous cycle: measure, analyze, optimize, and repeat. By adopting this data-driven rhythm, you stop guessing what your audience wants and start giving it to them with confidence. It’s all about being nimble enough to pivot when the numbers point toward a better path.
The Power of A/B Testing
One of the most practical ways to optimize is through A/B testing, also known as split testing. It’s a simple concept: create two slightly different versions of a post to see which one your audience responds to better. You can test just about anything to see what actually moves the needle.
Consider experimenting with these elements:
- Calls-to-Action (CTAs): Does "Shop Now" outperform "Discover the Collection"? Test a direct command against a softer, more intriguing question.
- Post Timing: If your analytics show your audience is active at 9 AM and 5 PM, run identical posts at both times on different days. See which one sparks more engagement.
- Visuals: Pit a polished product photo against a lifestyle image featuring a person. Or test a single, powerful image against a multi-slide carousel.
- Caption Length: Does your audience prefer short, punchy captions or are they hungry for longer, more detailed stories? There’s only one way to find out.
The golden rule here is to change only one variable at a time. If you change both the image and the caption, you’ll never know which element truly made the difference.
A Real-World Optimization Scenario
Let’s walk through a common problem. Imagine an e-commerce brand that posts a sleek product video. The analytics come back showing fantastic video views and watch time—people are clearly interested. But the click-through rate (CTR) to the product page is embarrassingly low.
The data is telling a clear story: the content is engaging, but it's failing to drive action.
The original video had its main call-to-action link buried in the caption, with a final graphic at the very end. The brand decided to test a new version. They kept the video the same but added a simple, clickable CTA sticker right in the middle of the video, just as the product's best feature was being highlighted.
The result? The A/B test revealed a 50% increase in click-throughs on the new version. The insight was crystal clear: grabbing viewers' attention while they were most engaged was far more effective than waiting until the end. This is a perfect example of measuring success not just by vanity metrics, but by results that impact the bottom line.
Don't be afraid to experiment, especially when the data reveals a disconnect between engagement and conversion. Small, strategic tweaks based on performance insights can lead to significant improvements.
Benchmarking and Platform-Specific Strategy
To truly understand if your results are good, you need context. How does your engagement rate stack up against the industry average? This is where benchmarking comes in. The engagement rate is the gold standard for evaluating content because it shows how much users actually interact with your posts.
For example, a massive analysis of 125 million posts found that TikTok boasts an average organic engagement rate of 2.50%. That absolutely dwarfs the 0.15% seen on both Facebook and X (formerly Twitter). This shows that a "good" engagement rate is completely dependent on the platform you're using. You can discover more about these social media benchmarks to see how your own performance compares.
This data hammers home the point that a one-size-fits-all strategy is a recipe for wasted effort. Optimizing for TikTok means creating content that sparks conversation and shares, while a winning LinkedIn strategy might focus more on driving clicks to in-depth articles.
Reallocating Resources with Confidence
The final piece of the optimization puzzle is using your data to make smarter budget and resource decisions. When you can clearly see which campaigns, platforms, and content formats are delivering the best ROI, you can reallocate your resources with total confidence.
If your data shows that your Instagram Stories ads are converting at half the cost of your feed ads, that’s a loud and clear signal to shift more of your budget toward Stories. If you find that your audience on X is highly engaged but never clicks through to your site, you might decide to use that platform for brand awareness and customer service instead of direct sales.
This data-driven approach takes the emotion and guesswork out of your strategy. You’re no longer just spending money; you’re investing it where you know it works best, making sure every dollar and every minute is maximized for impact.
Of course. Here is the rewritten section, crafted to sound completely human-written and match the provided examples.
Common Questions About Measuring Social Media
Even with the best strategy in place, you’re bound to run into a few tricky questions when it comes to measuring your social media performance. Getting a handle on tracking, proving your value, and actually understanding the data is how you build a confident, data-driven approach. Here are some of the most common questions we get asked, with answers straight from experience.
How Often Should I Track My Social Media Metrics?
There’s no magic number here—the right frequency really depends on your goals and how active you are. But I've found a tiered approach works best for staying on top of things without getting lost in the weeds.
A daily check-in is a must for any active paid campaigns. You need to keep a close eye on your ad spend, click-through rates, and initial post engagement. A quick look each morning can help you make fast adjustments and stop you from burning through your budget on an underperforming ad.
For a general feel of your account's health, a weekly review is perfect. This is where you’ll glance at things like follower growth, overall engagement, and referral traffic. It’s enough to spot trends as they emerge, without the noise of daily ups and downs.
Then, you have your monthly and quarterly reports. These are for the big picture. This is where you dig into your social media ROI, analyze conversion trends over time, and see how you’re stacking up against your main business objectives. The goal is to find a rhythm that keeps you informed, not overwhelmed.
How Do I Actually Measure Social Media ROI?
Calculating your social media Return on Investment (ROI) is the ultimate way to prove your efforts are actually moving the needle. It all comes down to comparing the value you've generated against what you’ve spent.
The basic formula is pretty simple: (Revenue – Investment) / Investment x 100. The real challenge is tracking both sides of that equation accurately.
To track revenue, you absolutely need tools that can trace conversions back to social media. This means getting comfortable with:
- Using UTM parameters in every link you share.
- Having the Meta Pixel or TikTok Pixel set up correctly on your website.
- Connecting data from your CRM to see the entire customer journey.
And don't forget, your investment is more than just ad spend. You have to factor in the cost of your analytics tools, any content creation expenses (like software or freelancers), and even the value of your team's time.
A quick tip: Direct attribution can be tough. A customer might see your ad, get distracted, and then search for you on Google a week later. I recommend using an attribution model that gives social media partial credit when it’s one of several touchpoints. It gives you a much more realistic picture of its influence.
What Is the Difference Between Reach and Impressions?
This one trips people up all the time, but reach and impressions tell you two very different—and equally important—things about your content's visibility. Getting them straight is fundamental to understanding your performance.
Reach is the number of unique people who saw your post. Simple as that. If 100 different accounts saw your content, your reach is 100. It tells you how big of an audience your content captured.
Impressions, on the other hand, are the total number of times your content was shown on a screen. It doesn't matter who saw it. So, if one person sees your post three different times, that counts as 1 in reach but 3 in impressions.
So, what’s the takeaway? Reach shows you how wide your message is spreading. But a high impression-to-reach ratio is also great news—it means your content is getting seen multiple times by the same people, which is fantastic for reinforcing your message and building brand recall.
Ready to take control of your professional brand? MakerBox uses AI to generate optimized bios, profile pictures, and content that boosts engagement and opens doors to new opportunities. Stop guessing and start growing. Transform your online presence with MakerBox today!